There are two possibilities: either I’m crazy, or everyone else is wrong.
Well, I’m ’bout to prove I’m not wrong.
Yes, I know it’s hard for people to accept we should abandon the standard stats curriculum in favor of the GLM.
But you can’t deny you’ll get identical results doing a t-test as a GLM.
“Prove it!,” you say?
Well, I am happy to oblige.
Let’s go ahead and run a regular old t-test:
require(flexplot)
data(avengers)
t.test(ptsd~north_south, data=avengers, var.equal=TRUE)
##
##  Welch Two Sample t-test
##
## data:  ptsd by north_south
## t = -8.195, df = 810, p-value = 9.755e-16
## alternative hypothesis: true difference in means is not equal to 0
## 95 percent confidence interval:
##  -0.4112410 -0.2523058
## sample estimates:
## mean in group north mean in group south
##            3.834729            4.166502
(Note the default t-test in R, Welch’s, does a correction which will make it not equal to a regression, hence the var.equal=TRUE. Thanks for the reminder Michael!)
Now let’s do the same thing as a glm:
mod = lm(ptsd~north_south, data=avengers)
summary(mod)
##
## Call:
## lm(formula = ptsd ~ north_south, data = avengers)
##
## Residuals:
##     Min      1Q  Median      3Q     Max
## -2.0347 -0.3665 -0.0347  0.3653  3.2335
##
## Coefficients:
##                  Estimate Std. Error t value Pr(>|t|)
## (Intercept)       3.83473    0.02863 133.954  < 2e-16 ***
## north_southsouth  0.33177    0.04048   8.195 9.76e-16 ***
## ---
## Signif. codes:  0 '***' 0.001 '**' 0.01 '*' 0.05 '.' 0.1 ' ' 1
##
## Residual standard error: 0.5768 on 810 degrees of freedom
## Multiple R-squared:  0.07656,    Adjusted R-squared:  0.07542
## F-statistic: 67.16 on 1 and 810 DF,  p-value: 9.755e-16
Oh, would you look at that. The t-statistic for the t-test (-8.195) is exactly the same as the t-statistic for the “slope” in the linear model (8.195), at least in absolute value. (The t-test version subtracts north from south, while the glm version does the opposite).
It’s. The. Same. Thing.
Bazinga.
Except the GLM approach gives you more than the t-test and is easily expandable; the t-test is NOT.
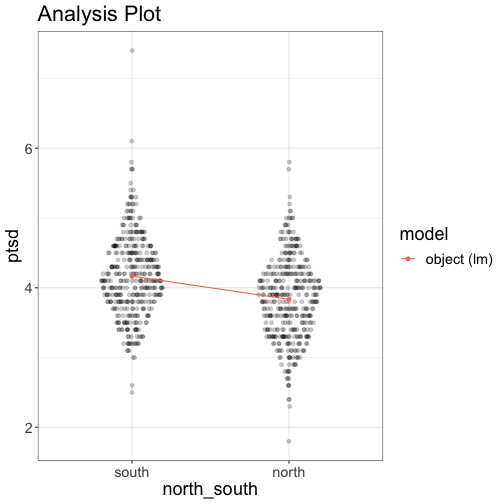
And, of course, we might as well look at a graphic of the glm (which you cannot do with the t-test, btw).
visualize(mod, plot="model")